Fragility Curve Overtopping (wave data)
Voor het berekenen van een fragility curve voor het mechanisme GEKB wordt gebruikt gemaakt van de pydra_core module, meer documentatie over de pydra_core module is hier te vinden.
De module wordt gebruikt om een overslag debiet te berekenen op basis van gegeven golfhoogte, golfperiode en golfrichting per locatie/windrichting/windsnelheid (wavedata) voor verschillende omstandigheden. Op basis hiervan wordt een fragility curve opgesteld.
from pathlib import Path

import matplotlib.pyplot as plt

from toolbox_continu_inzicht.fragility_curves import (
    ChangeCrestHeightFragilityCurveOvertoppingWaveData,
    FragilityCurveOvertoppingWaveData,
    ShiftFragilityCurveOvertoppingWaveData,
)
from toolbox_continu_inzicht.base.data_adapter import Config, DataAdapter
path = Path.cwd() / "data_sets" / "8.fragility_curve_overtopping_wavedata"
config = Config(config_path=path / "test_fragility_curve_overtopping_wavedata.yaml")
config.lees_config()
data_adapter = DataAdapter(config=config)De volgende configuratie wordt gebruikt voor het maken van een GEKB curve
GlobalVariables:
    rootdir: "data_sets/8.fragility_curve_overtopping_wavedata"
    moments: [ -24, 0, 24, 48 ]
    logging:
        level: INFO
    FragilityCurveOvertoppingWaveData:
        closing_situation: 1

DataAdapter:
    default_options:
        csv:
            sep: ","
    slopes:
        type: csv
        file: "slopes_5.csv"
    profiles:
        type: csv
        file: "profiles_new.csv"
    waveval_uncert:
        type: csv
        file: "waveval_uncert_5.csv"
        index_col: false
    waveval_id:
        type: csv
        file: "waveval_id_5.csv"
        index_col: false
    waveval:
        type: csv
        file: "waveval_5.csv"
        index_col: false
    fragility_curves:
        type: csv
        file: "fragility_curves_5.csv"
Er zijn vijf verschillende data bestanden nodig.
Ten eerste een tabel met de informatie over de helling (slope) waarvoor de curve wordt afgeleid.
data_adapter.input("slopes")| profileid | slopetypeid | x | y | r | damheight | |
|---|---|---|---|---|---|---|
| 0 | 5 | 1 | -12.59 | 10.76 | 1 | 0 |
| 1 | 5 | 1 | 0.00 | 14.63 | 1 | 0 |
| 2 | 5 | 2 | -68.82 | 10.00 | 1 | 0 |
| 3 | 5 | 2 | -12.59 | 10.76 | 1 | 0 |
Ten tweede informatie over de hoogte van de kruin, de orientatie, of er een dam is, maatgevende windsnelheid enz.
data_adapter.input("profiles")| parameters | values | |
|---|---|---|
| 0 | sectionid | 11 |
| 1 | crestlevel | 14.63 |
| 2 | orientation | 167 |
| 3 | dam | 0 |
| 4 | damheight | 0 |
| 5 | qcr | closed |
| 6 | windspeed | 20 |
| 7 | sectormin | 180.0 |
| 8 | sectorsize | 90.0 |
| 9 | closing_situation | 0 |
Ten derde de onzekerheden van de golfparameters per HR-locatie (modelonzekerheden).
data_adapter.input("waveval_uncert")| hr_locid | closing_situation | waveval_type | mean | stddev | |
|---|---|---|---|---|---|
| 0 | 13421200 | 1 | 2 | 0.94 | 0.15 |
| 1 | 13421200 | 1 | 6 | 0.89 | 0.04 |
| 2 | 13421200 | 2 | 2 | 0.94 | 0.15 |
| 3 | 13421200 | 2 | 6 | 0.89 | 0.04 |
Ten vierde de index voor de golfcombinaties (per windrichting en windsnelheid) met het type golfparameter.
data_adapter.input("waveval_id")| waveval_id | waveval_type | hr_locid | hr_location | winddir | windspeed | |
|---|---|---|---|---|---|---|
| 0 | 1 | 2 | 13421200 | 034-02_0200_9_HD_km0996 | 225.0 | 0.0 |
| 1 | 2 | 2 | 13421200 | 034-02_0200_9_HD_km0996 | 225.0 | 10.0 |
| 2 | 3 | 2 | 13421200 | 034-02_0200_9_HD_km0996 | 225.0 | 20.0 |
| 3 | 4 | 2 | 13421200 | 034-02_0200_9_HD_km0996 | 225.0 | 30.0 |
| 4 | 5 | 2 | 13421200 | 034-02_0200_9_HD_km0996 | 225.0 | 42.0 |
| ... | ... | ... | ... | ... | ... | ... |
| 256 | 257 | 7 | 13421200 | 034-02_0200_9_HD_km0996 | 202.5 | 0.0 |
| 257 | 258 | 7 | 13421200 | 034-02_0200_9_HD_km0996 | 202.5 | 10.0 |
| 258 | 259 | 7 | 13421200 | 034-02_0200_9_HD_km0996 | 202.5 | 20.0 |
| 259 | 260 | 7 | 13421200 | 034-02_0200_9_HD_km0996 | 202.5 | 30.0 |
| 260 | 261 | 7 | 13421200 | 034-02_0200_9_HD_km0996 | 202.5 | 42.0 |
261 rows × 6 columns
Ten vijfde de daadwerkelijke golfwaarden per waterstand, gekoppeld aan de golfcombinaties via waveval_id.
data_adapter.input("waveval").head(4) # (ingekorte versie)| waveval_id | waterlevel | waveval | |
|---|---|---|---|
| 0 | 1 | 0.524700 | 0.0 |
| 1 | 1 | 0.723951 | 0.0 |
| 2 | 1 | 0.923203 | 0.0 |
| 3 | 1 | 1.122454 | 0.0 |
Deze informatie wordt mee gegeven aan de FragilityCurveOvertoppingWaveData voor het genereren van een curve.
fragility_curve_overtopping = FragilityCurveOvertoppingWaveData(
    data_adapter=data_adapter
)
fragility_curve_overtopping.run(
    input=[
        "slopes",
        "profiles",
        "waveval_uncert",
        "waveval_id",
        "waveval",
    ],
    output="fragility_curves",
)
2026-07-20 10:12:47 INFO - fragility_curve_overtopping_base: Overtopping model uncertainty override: closing_situation=1, key=gh_onz_mu, global=None, override=0.94
2026-07-20 10:12:47 INFO - fragility_curve_overtopping_base: Overtopping model uncertainty override: closing_situation=1, key=gh_onz_sigma, global=None, override=0.15
2026-07-20 10:12:47 INFO - fragility_curve_overtopping_base: Overtopping model uncertainty override: closing_situation=1, key=gp_onz_mu_tspec, global=None, override=0.89
2026-07-20 10:12:47 INFO - fragility_curve_overtopping_base: Overtopping model uncertainty override: closing_situation=1, key=gp_onz_sigma_tspec, global=None, override=0.04Deze curve kunnen we vervolgens weergeven:
fig, ax = plt.subplots()
fragility_curve_overtopping.as_dataframe().set_index("hydraulicload").plot(ax=ax)
ax.set_ylabel("Failure probability");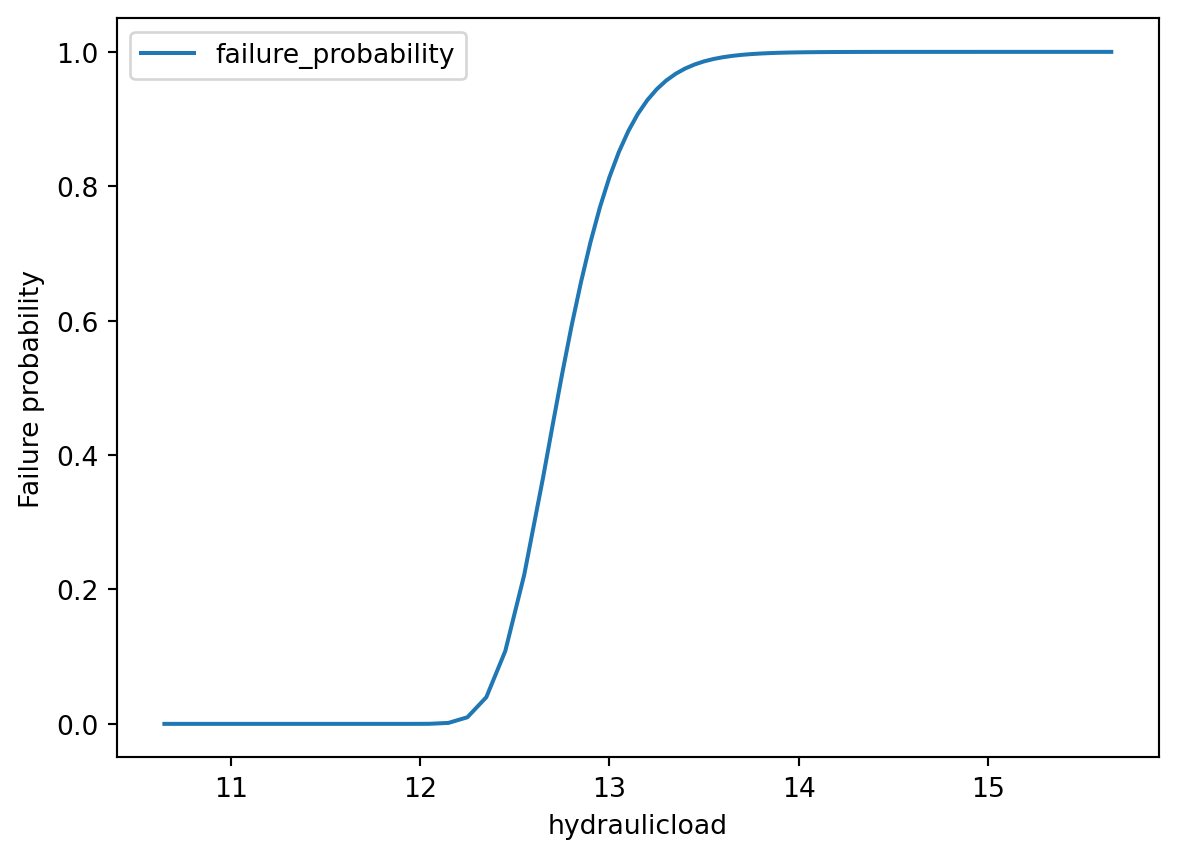
data_adapter.input("fragility_curves")| Unnamed: 0 | hydraulicload | failure_probability | |
|---|---|---|---|
| 0 | 0 | 10.65 | 0.000000e+00 |
| 1 | 1 | 10.75 | 0.000000e+00 |
| 2 | 2 | 10.85 | 0.000000e+00 |
| 3 | 3 | 10.95 | 0.000000e+00 |
| 4 | 4 | 11.05 | 1.487230e-168 |
| ... | ... | ... | ... |
| 76 | 76 | 15.45 | 9.999996e-01 |
| 77 | 77 | 15.50 | 9.999997e-01 |
| 78 | 78 | 15.55 | 9.999998e-01 |
| 79 | 79 | 15.60 | 9.999998e-01 |
| 80 | 80 | 15.65 | 9.999998e-01 |
81 rows × 3 columns
In sommige gevallen wil je een fragility curve ook aan kunnen passen, om dit mogelijk te maken zijn verschillende functie beschikbaar die het zelfde doen als de originele functie maar een kleine, door de gebruiker opgelegde, aanpassingen doen.
Zo verschuift de functie ShiftFragilityCurveOvertoppingWaveData de fragility curve met een effect.
shift_fragility_curve_overtopping = ShiftFragilityCurveOvertoppingWaveData(
    data_adapter=data_adapter
)
shift_fragility_curve_overtopping.run(
    input=[
        "slopes",
        "profiles",
        "waveval_uncert",
        "waveval_id",
        "waveval",
    ],
    output="fragility_curves",
    effect=0.5,
)
2026-07-20 10:12:48 INFO - fragility_curve_overtopping_base: Overtopping model uncertainty override: closing_situation=1, key=gh_onz_mu, global=None, override=0.94
2026-07-20 10:12:48 INFO - fragility_curve_overtopping_base: Overtopping model uncertainty override: closing_situation=1, key=gh_onz_sigma, global=None, override=0.15
2026-07-20 10:12:48 INFO - fragility_curve_overtopping_base: Overtopping model uncertainty override: closing_situation=1, key=gp_onz_mu_tspec, global=None, override=0.89
2026-07-20 10:12:48 INFO - fragility_curve_overtopping_base: Overtopping model uncertainty override: closing_situation=1, key=gp_onz_sigma_tspec, global=None, override=0.04fig, ax = plt.subplots(1, 1)
# pas de namen van de kolommen aan voor de plot
df_overtopping = (
fragility_curve_overtopping.as_dataframe()
.set_index("hydraulicload")
.rename(columns={"failure_probability": "original"})
)
df_overtopping_shift = (
shift_fragility_curve_overtopping.as_dataframe()
.set_index("hydraulicload")
.rename(columns={"failure_probability": "shifted"})
)
# plotten
df_overtopping.plot(ax=ax)
df_overtopping_shift.plot(ax=ax, linestyle="--", label="shifted")
ax.set_ylabel("Failure probability");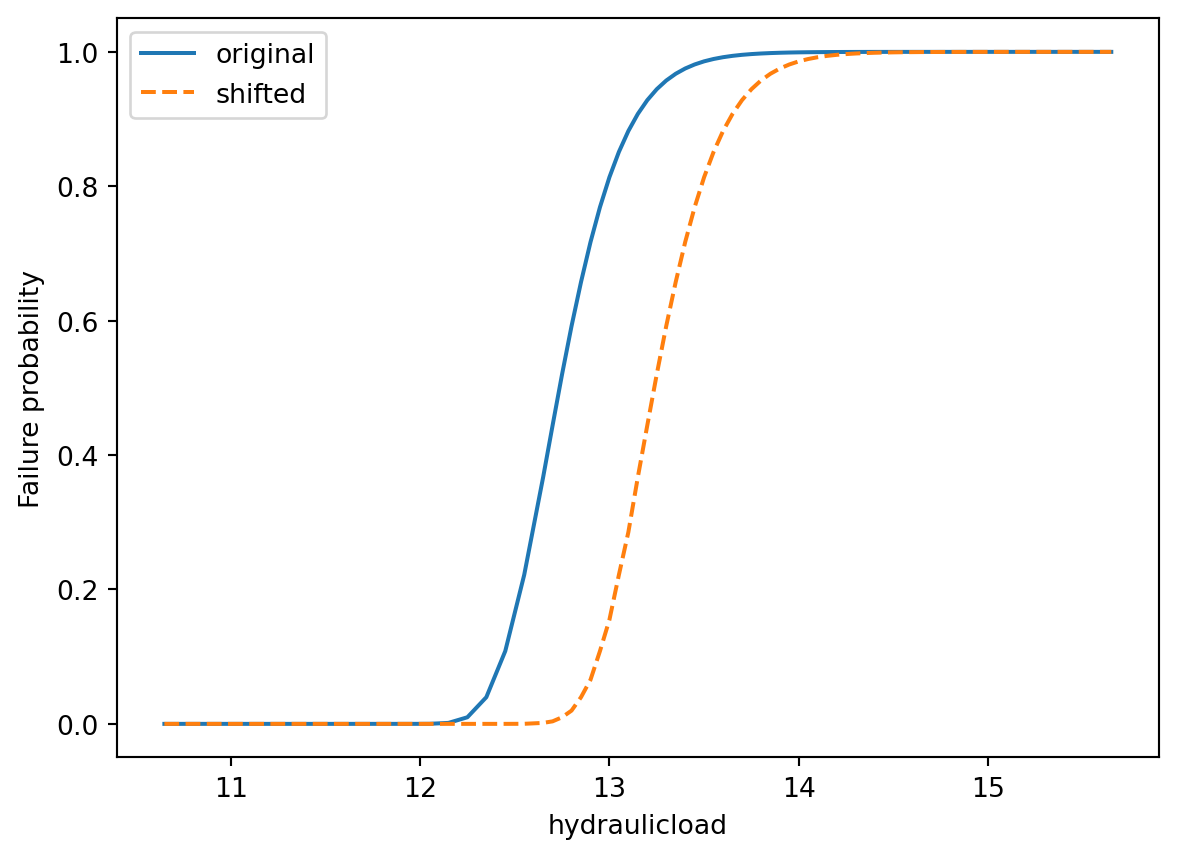
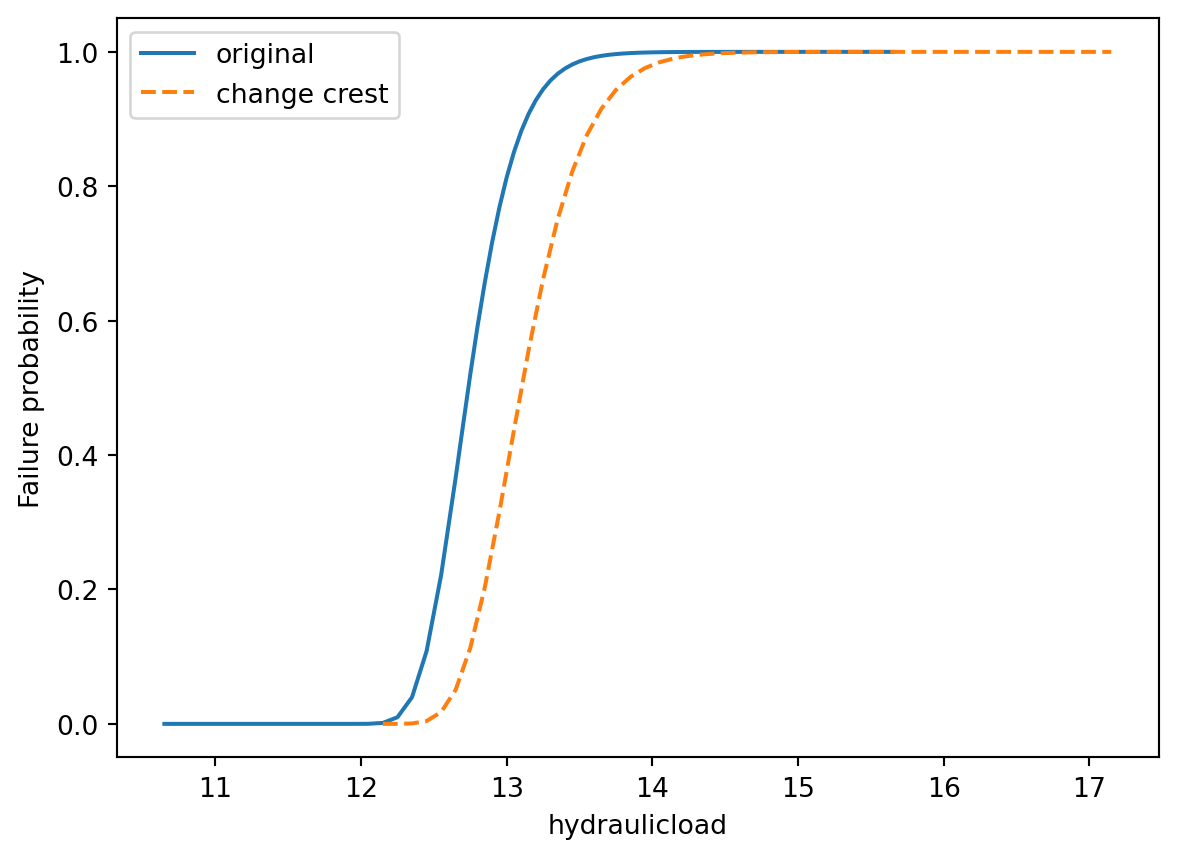
Waar verschuiven een relatief simple nabewerking op de data is, kunnen aanpassingen aan de berekening zelf ‘on-the-fly’ plaatsvinden.
Zo kan als maatregel de kruinhoogte worden verhoogt, met de functie ChangeCrestHeightFragilityCurveOvertoppingBedlevelFetch is dit mogelijk.
change_crest_fragility_curve_overtopping = (
    ChangeCrestHeightFragilityCurveOvertoppingWaveData(data_adapter=data_adapter)
)

change_crest_fragility_curve_overtopping.run(
    input=[
        "slopes",
        "profiles",
        "waveval_uncert",
        "waveval_id",
        "waveval",
    ],
    output="fragility_curves",
    effect=1.5,
)
2026-07-20 10:12:48 INFO - fragility_curve_overtopping_base: Overtopping model uncertainty override: closing_situation=1, key=gh_onz_mu, global=None, override=0.94
2026-07-20 10:12:48 INFO - fragility_curve_overtopping_base: Overtopping model uncertainty override: closing_situation=1, key=gh_onz_sigma, global=None, override=0.15
2026-07-20 10:12:48 INFO - fragility_curve_overtopping_base: Overtopping model uncertainty override: closing_situation=1, key=gp_onz_mu_tspec, global=None, override=0.89
2026-07-20 10:12:48 INFO - fragility_curve_overtopping_base: Overtopping model uncertainty override: closing_situation=1, key=gp_onz_sigma_tspec, global=None, override=0.04fig, ax = plt.subplots(1, 1)
# pas de namen van de kolom aan voor de plot
df_overtopping_change_crest = (
change_crest_fragility_curve_overtopping.as_dataframe()
.set_index("hydraulicload")
.rename(columns={"failure_probability": "change crest"})
)
# plotten
df_overtopping.plot(ax=ax)
df_overtopping_change_crest.plot(ax=ax, linestyle="--")
ax.set_ylabel("Failure probability");