Aanpassen van geïntegreerde faalkans
Voor de module impactanalyse kan een totale of geïntegreerde faalkans worden berekend. Dit is een combinatie van een overschrijdingsfrequentielijn en een fragility curve. Om het mogelijk te maken om de fragility curve aan te passen kan de functie FragilityCurve.reliability_update() worden gebruikt. Het process van combineren, aanpassen en weer combineren wordt hier weergegeven.
from pathlib import Path

import matplotlib.pyplot as plt


from toolbox_continu_inzicht import Config, DataAdapter
path = Path.cwd() / "data_sets" / "4.adjust_integrated_statistics"
config = Config(config_path=path / "integrate_statistics.yaml")
config.lees_config()
data_adapter = DataAdapter(config=config)from toolbox_continu_inzicht.fragility_curves import IntegrateFragilityCurveVoor het bepalen van een totale jaarlijkse kans combineren we een conditionele kans (fragility curve, wat iets zegt over de sterkte) met een kans dat die belasting optreedt (waterstands frequentiecurve). Hiervoor maken we gebruik van de functie IntegrateFragilityCurve.
fig, ax = plt.subplots(1)
fragility_curve_df = data_adapter.input("fragility_curve_csv")
exceedance_curve_df = data_adapter.input("exceedance_curve_csv")

fragility_curve_df.plot(x="hydraulicload", ax=ax)
ax.set_ylabel("Failure probability")
ax2 = ax.twinx()
exceedance_curve_df.plot(x="hydraulicload", ax=ax2, color="C1")

# maak een mooie legenda
ax2.legend().remove()
handles, labels = ax.get_legend_handles_labels()
handles_, labels_ = ax2.get_legend_handles_labels()
ax.legend(handles + handles_, labels + labels_);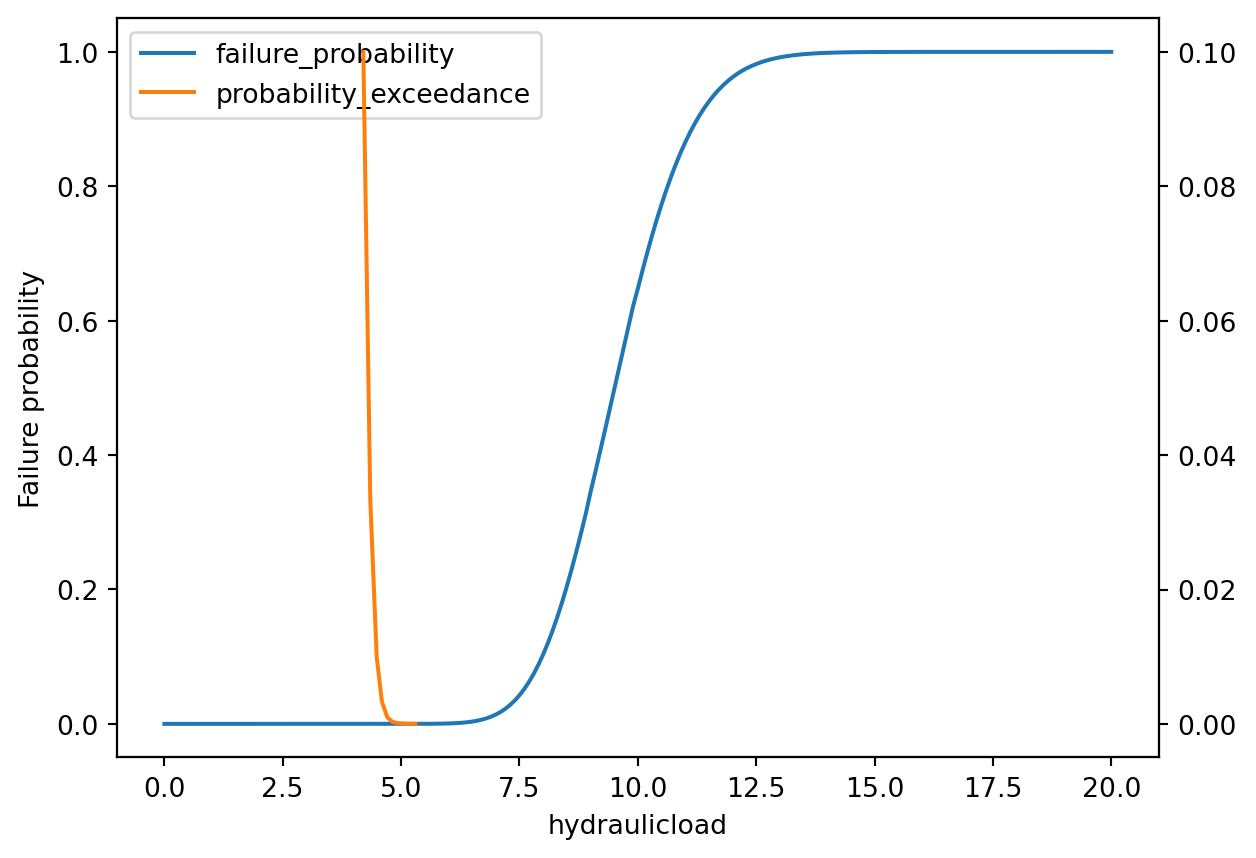
Met de functie IntegrateFragilityCurve integreren we de fragility curve uit
integrate_statistics_per_section = IntegrateFragilityCurve(data_adapter=data_adapter)
integrate_statistics_per_section.run(
    input=["exceedance_curve_csv", "fragility_curve_csv"], output="result"
)
Deze kans voor een gegeven waterstand kunnen we weergeven in een grafiek
initial_integrated_curve = integrate_statistics_per_section.df_out
fig, ax = plt.subplots()
ax.bar(
    initial_integrated_curve["hydraulicload"],
    initial_integrated_curve["probability_contribution"],
    width=0.1,
)
ax.set_xlim([0, 10])
ax.set_xlabel("Water level")
ax.set_ylabel("Probability contribution");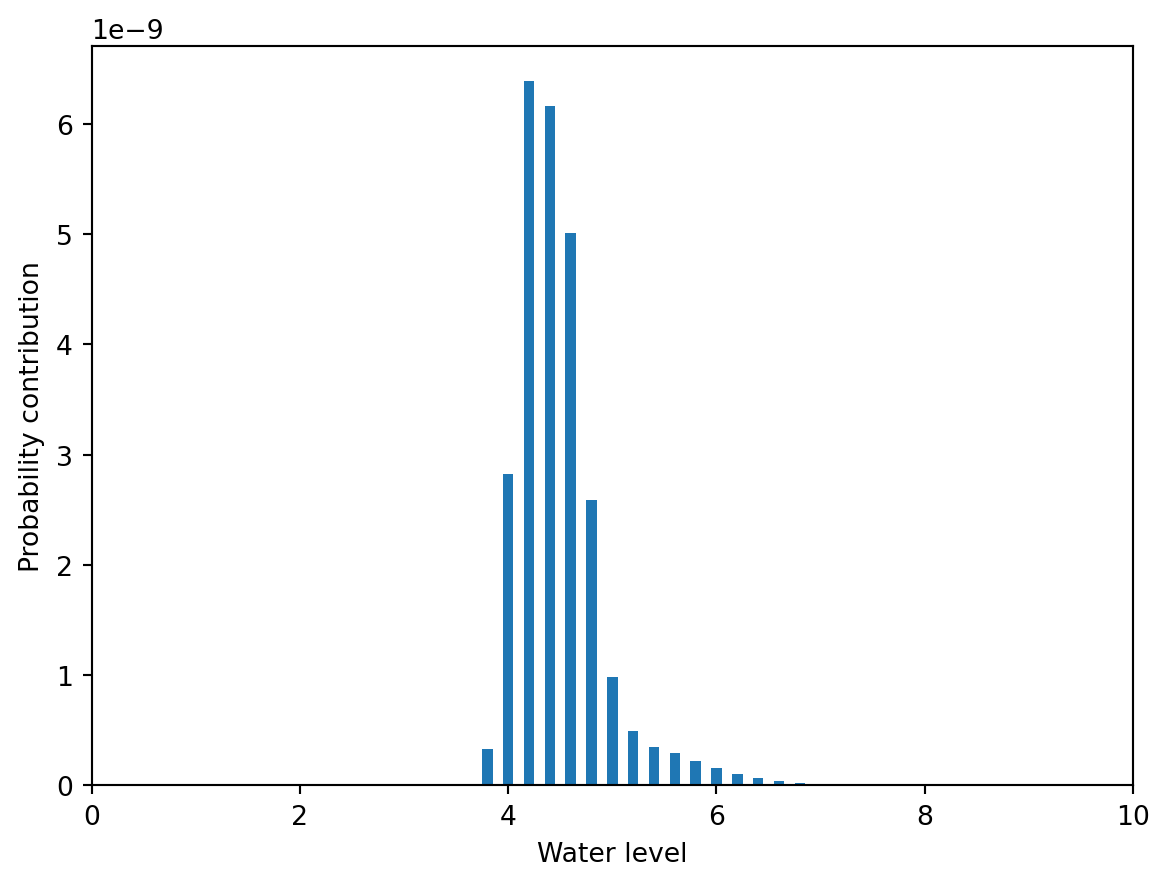
In sommige gevallen wil een beheerder dit aanpassen, bijvoorbeeld omdat hij weet dat een bepaalde waterstand al is opgetreden. Dit aanpassen kan met de functie FragilityCurve.reliability_update()
from toolbox_continu_inzicht.base.fragility_curve import FragilityCurveupdate_level = 4.3
trust_factor = 1
fragility_curve = FragilityCurve(data_adapter=data_adapter)
fragility_curve.load("fragility_curve_csv")
fragility_curve.reliability_update(update_level=update_level, trust_factor=trust_factor)Hier komt een nieuwe curve uit
data_adapter.set_dataframe_adapter(
"updated_fragility_curve", fragility_curve.as_dataframe(), if_not_exist="create"
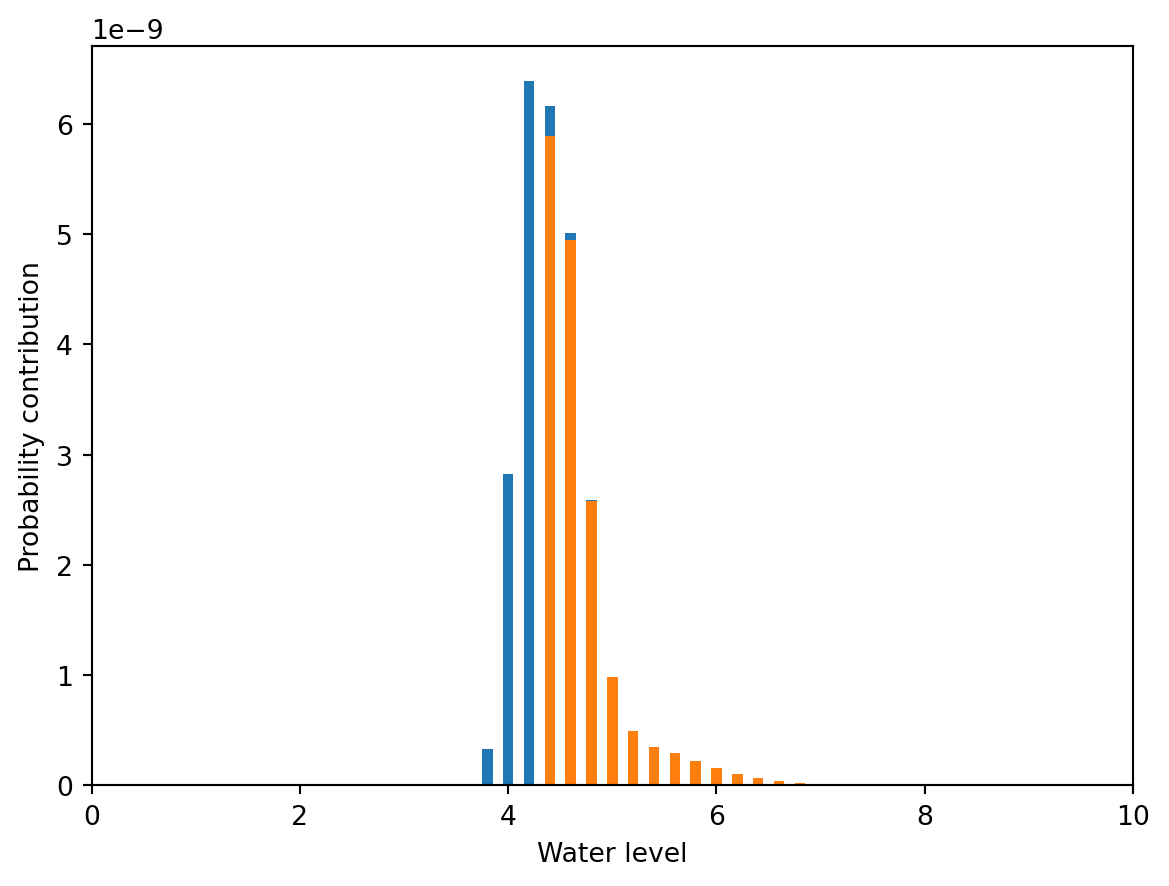
)Hier kunnen we opnieuw voor integreren en en we zien dat de curve naar rechts is opgeschoven.
integrate_statistics_per_section = IntegrateFragilityCurve(data_adapter=data_adapter)
integrate_statistics_per_section.run(
    input=["exceedance_curve_csv", "updated_fragility_curve"], output="result"
)
df_out = integrate_statistics_per_section.df_out
fig, ax = plt.subplots()
ax.bar(
initial_integrated_curve["hydraulicload"],
initial_integrated_curve["probability_contribution"],
width=0.1,
)
ax.bar(df_out["hydraulicload"], df_out["probability_contribution"], width=0.1)
ax.set_xlim([0, 10])
ax.set_xlabel("Water level")
ax.set_ylabel("Probability contribution");